So often when we think about the long tail of search, we think of the prevalence of phrases with three, four, five or more words.
Today I’m asking you to think of long tail keywords differently.
That long tail is affecting another long tail that I have yet to hear a lot of people talking about, and to be honest I think it’s hard to talk about because the answers are complex. I want to talk about the long tail of conversions.
But first some history:
As far back as I could find, Hitwise reported the following: approximately 25 percent of all searches in 2007 were one word. According to an aHrefs study, 2.8 percent of all searches are now just one word, with more than 85 percent being three or more words. Now stop and think that most brands are one or two words (Southwest, Delta, Sony, Moz, Seer Interactive, etc.), which means a lot of those one- and two word searches are probably brands who rank No. 1 for their brand anyway (in other words … no opportunity for you).

In my unending quest to integrate PPC and SEO, I have started working with clients who find competitor keywords and do a better job of prioritizing SEO based on keyword conversion propensity. Let’s be honest, all the data Google has “taken away” from those on SEO, they gladly keep giving PPC’ers, so go use that data.
For one client, I pulled all their conversions at the search term level for the past 12 months, and 1,698,576 unique search terms later, I noticed a trend that I am going to start looking at across all clients.
Of the one million search terms we were analyzing, 107,000 had assisted or received a direct conversion.
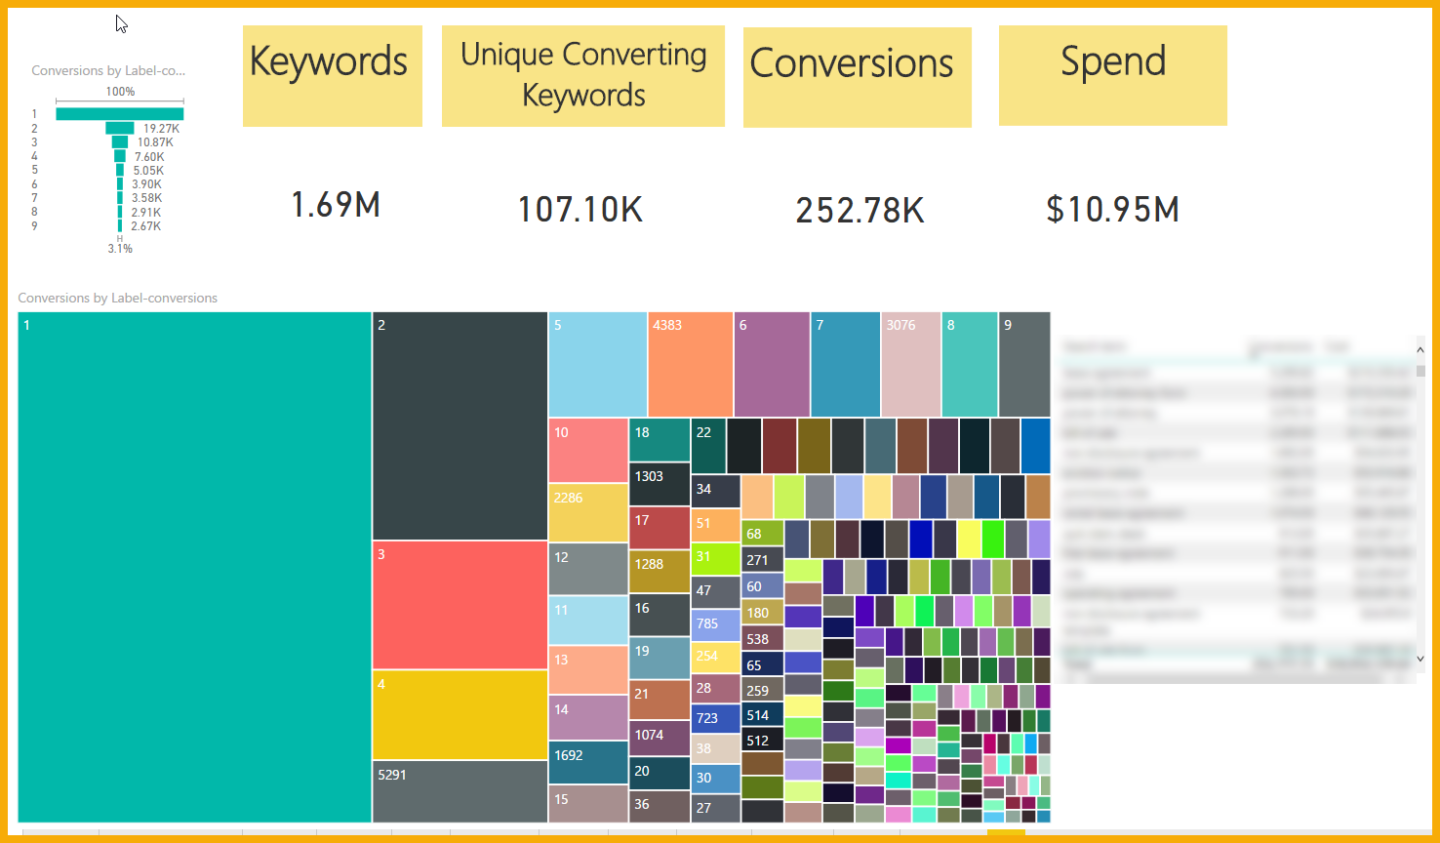
Here’s a breakdown of those 107K words:
Single conversion keywords (words that only converted once all year)

81 percent of this client’s unique converting keywords had only one conversion all year! But that represented 8.73 percent of its spend.
Unique keywords with only 1-4 conversions all year:
Now I wanted to see more. With three clicks, look what I found:
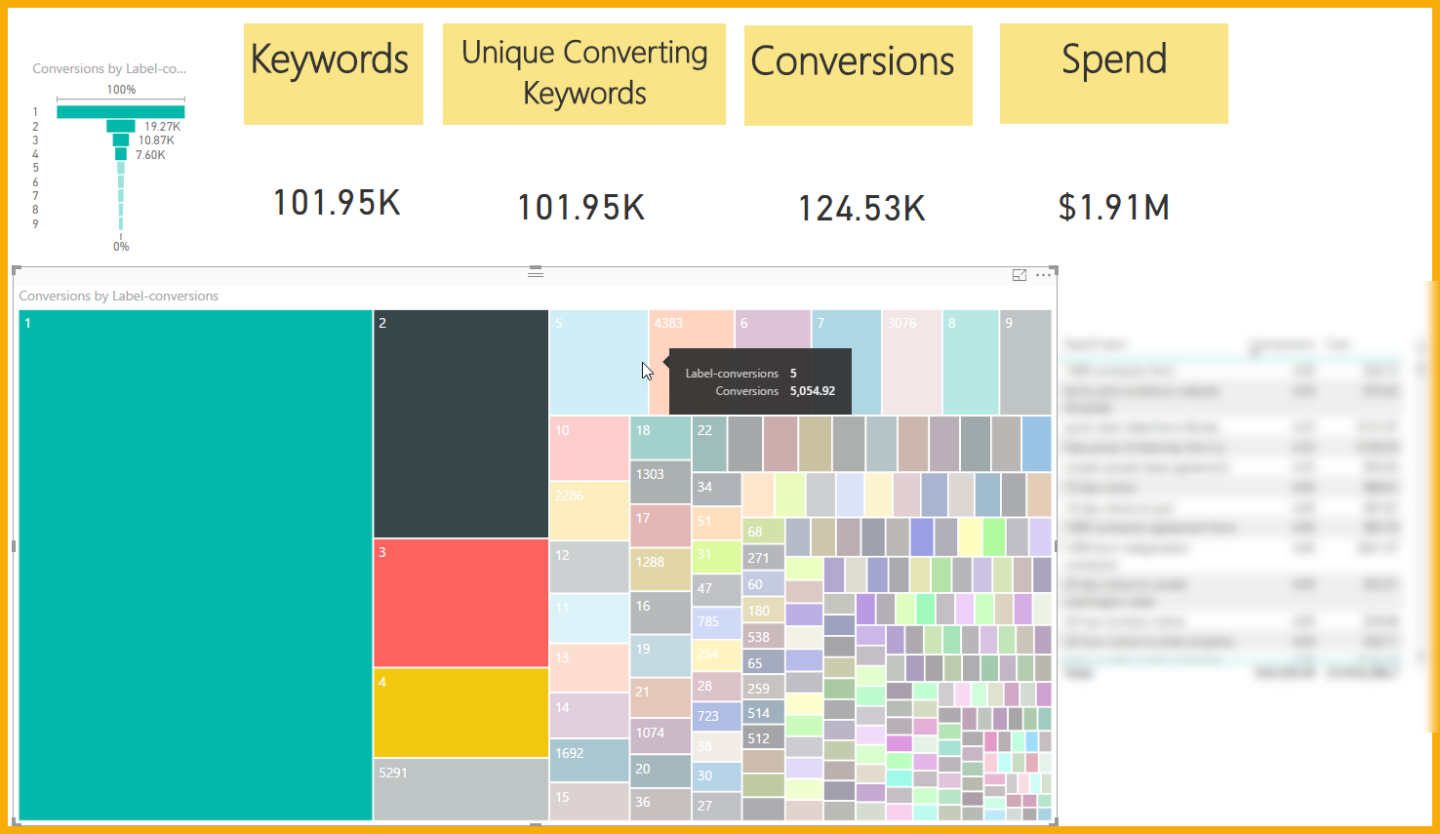
95.3 percent of all this client’s unique converting keywords had only 1-4 conversions all year, but that represented 17.4 percent of its spend.
Look at the ego words
So now I went to look at those big numbers: the top-8 head keywords.
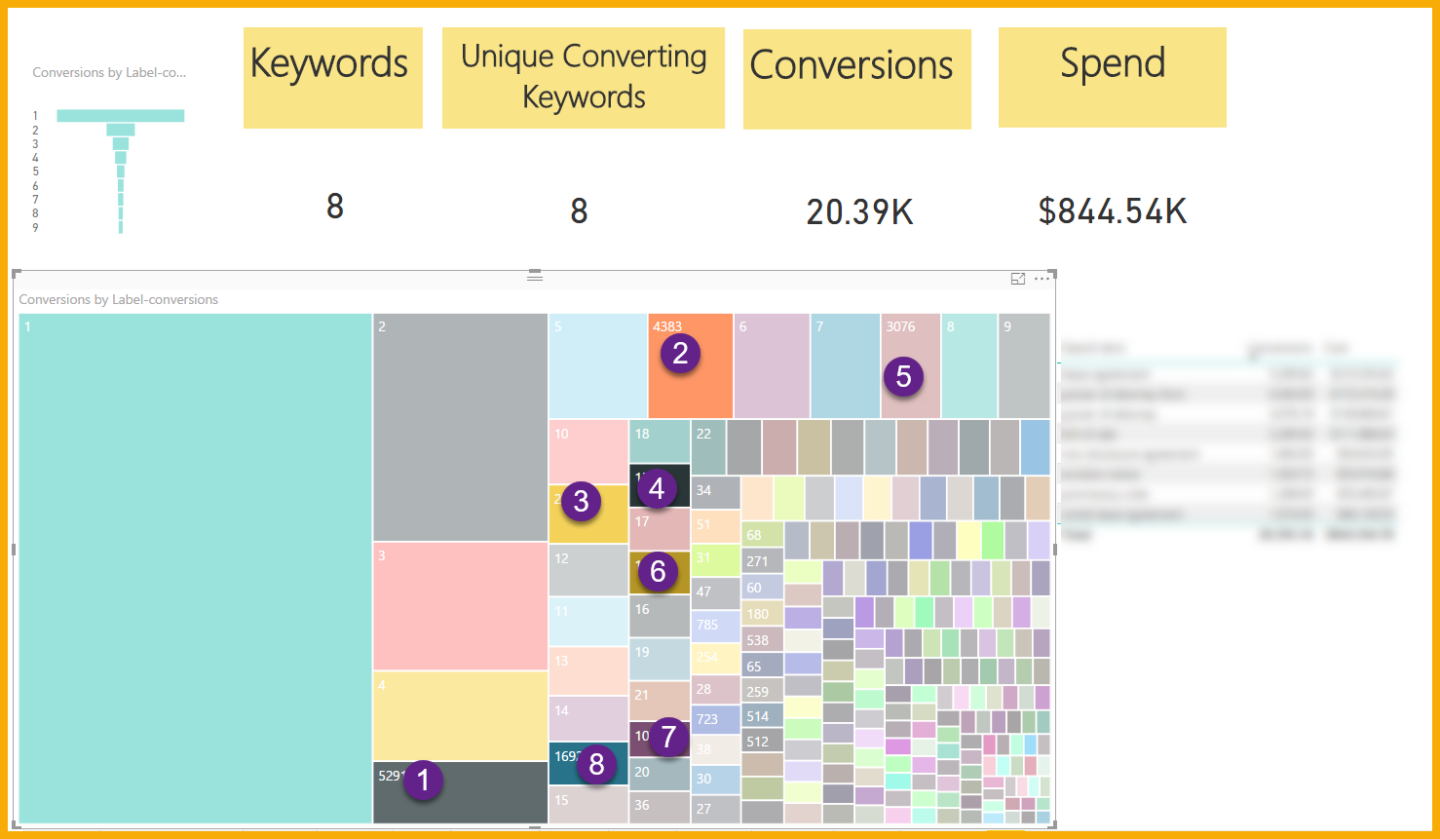
Interesting…
- Eight keywords that got 20,000 conversions = 7.71 percent of spend
- 86,787 keywords that got each got one conversion = 8.73 percent of spend
Keep in mind, those eight keywords are not special, like a high value category. They are just big head keywords.
Yet those eight keywords have an average Moz difficulty of 44 (with a few in the mid 50s), yet a sample of my 86,000 keywords showed most were around 20 (with a few in the 18s). Here is what Rand has to say about how to interpret the data (visit our friends at Moz here, for more):
Because of the weighted average, the use of Google’s top 10 results, and the fact that PA and DA are both on a logarithmic scale, there’s very few scores in the 0-20 range, and very few in the 80-100 range. I personally think of scores in the 20-35 range as being quite low, 36-50 in the middle, 51-65 pretty tough, and 66-80 as very difficult (your own intuition may vary based on your experiences, and that’s OK).
This is why so many of us in SEO go for the head or mid-tail. It’s kinda impossible to do keyword and competitive research to identify keyword opportunities for millions, much less build the content. So, we sort by search volume in a tool, like SEMRush, and get cranking on the top 1,000 or so. Seer is definitely changing that approach now that we’re running full steam ahead – using Tableau and Power BI to integrate data sets.
As people have started searching with more words in their queries, it creates a daunting task for SEOs. Think about it … where do you start, now that you know that more conversions happen on keywords that have received only 1-3 conversions all year? How do I produce enough content to cover that? How do I prioritize where to start?
You’ve got to use different tools to group the long tail to get a feel for how many pieces of content you need.
Beginner Long Tail Keyword Tools
When you are just starting off, bringing in thousands of words and categorizing them can be brutal. We know that you don’t need one keyword for each of your 60,000-plus terms, so I recommend using a tool like SEMRush. You’ll see that different sites (and different content structures) result in different penetrations of keywords per landing page. Let’s take an example for the word project management guide.
The format that Wrike uses results in a lot of individual pages. Compare that to teamgantt, which has one long page. Wrike seems to have fewer keywords to its page that ranks No. 1 vs. Teamgantt at No. 3.
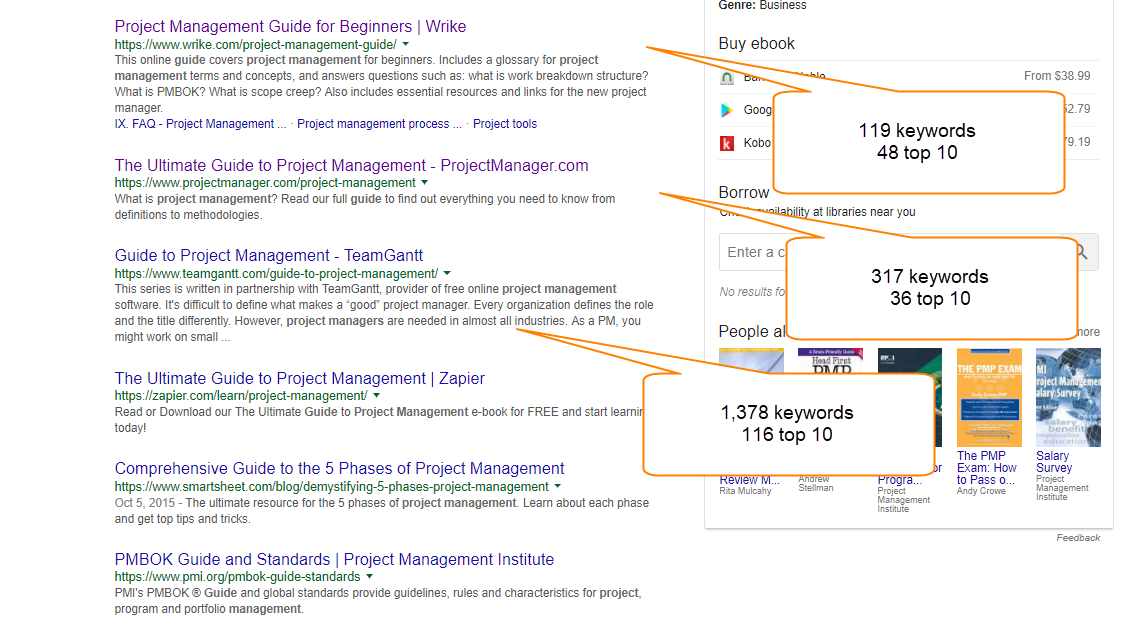
This very simple exercise should get you thinking: OK, it’s possible with longform content around project management to rank in the top 10 for 100-plus keywords. I’m saying that this is the only analysis, but if you are a beginner you could look at the wordcount of that page from teamgantt and say it’s possible to build content that has a chance to rank for 100 keywords per big page, so if your clusters show that to rank for 60,000 words, by going through this process you could now see that 60 big guides might get you there. That’s a lot less daunting than 60,000 thin pages. Teamgantt estimates that guide cost them X and took Y hours.
Now you’ve got to find the clusters from your top converting keywords:
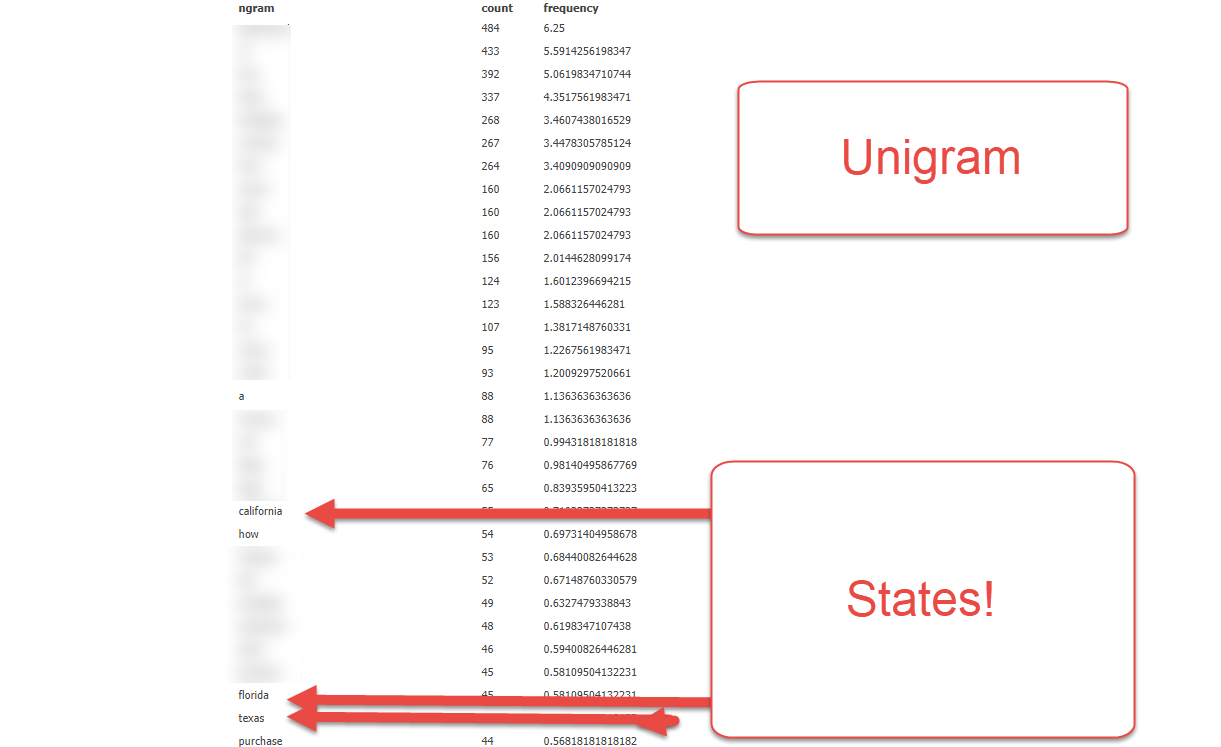
Run an N-Gram analysis to get some prioritization/groupings. Here’s a post that has the tools and a video on how to use them. My favorite is nGram analyzer.
Start with a unigram, then a bi gram, then a tri. Looking for patterns in unigrams gets me thinking about state clusters for this dataset.
BI Grams get me thinking about word templates and number of days as clusters.

Tri grams get me thinking “how to write” could be a cluster, and a phrasing/tone in my writing about three day, states and other clusters:
Word Clouds: Word clouds will also show themes in ways that nGrams do not, so just copy paste into your favorite word cloud tool to find themes as well.
Moz’s keyword explorer: This might be a good option for some, but at a 500-keyword limit, it’s, well, limiting when I’ve been running 10K to 500K keywords typically.
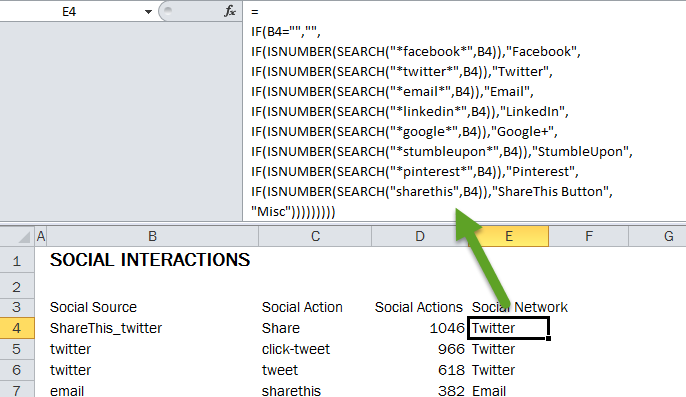
Excel: Good start. For the past year when I was working with the 5,000-10,000-keyword range, using this strategy was decent (beware, excel matches the word that comes first in the search string), so pretty quickly you realize this isn’t ideal. To solve, I swapped out sites with keyword categories thanks Annie). Go to Annie’s site to get started with searching for text in excel.
Other tools to consider for larger sets and also for more accuracy:
Meaningcloud plugin for Excel: I have found this to be OK. Free version lets you play around a good bit, so have at it.
Topvisor: This is a tool we’ve been playing with as well. It’s slowly becoming a favorite. It can get expensive quickly, but so far we like the output.
Advanced Long Tail Keyword Tools
I like filtering in Power BI once I get some groupings and see a state matters. I can now filter by state (or use a state graphic). But what I really like to do is take all converting keywords, run them through a rank checker that pulls the top 10, 20, 50 or 100 (depending on the tool/cost). ou then get HUGE FREAKING FILES, so now I can easily filter reports based on quick clusters found using my ngrams earlier.
Here is an example of the size of some of the files I’m combining for only one client:

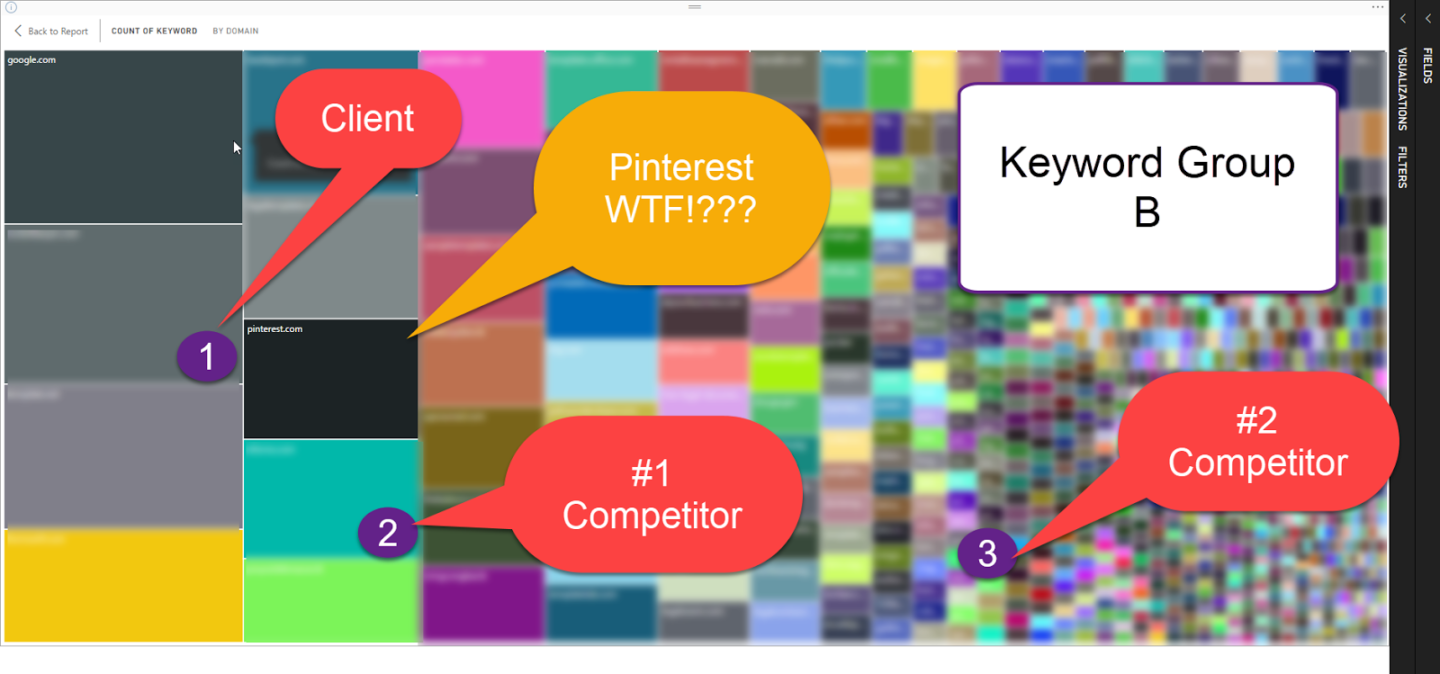
Let’s look at two keyword groups, Keyword Group A and Keyword Group B:

Group B

How did I do this?
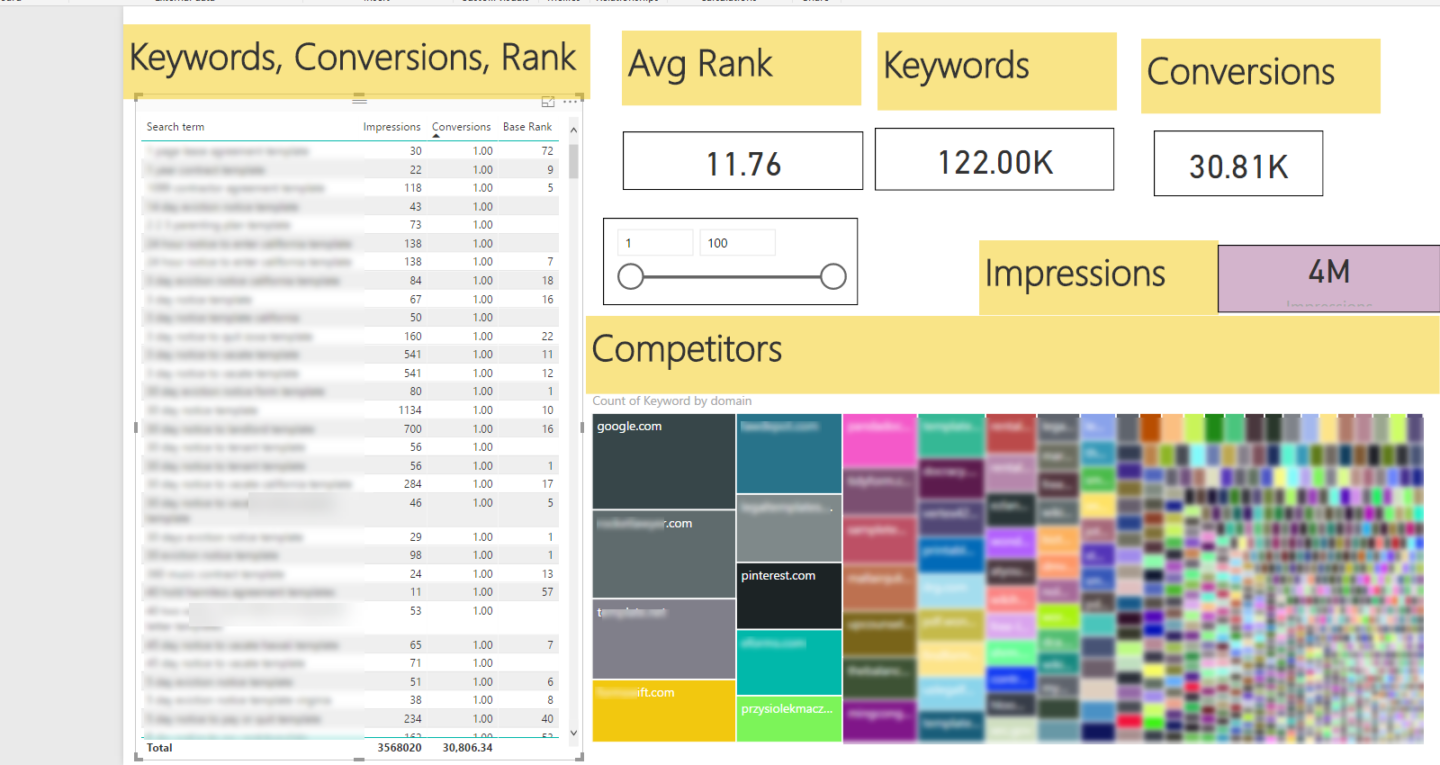
I took all of a client’s converting keywords, then pull a top-20 report from Getstat.com. With this, I now have a data set of the top 20 competitors for each keyword that has ever converted. Yup, that is 60,000 keywords times 20 URLs, 20 domains, 20 rankings, etc. You get it, we’ve got 5-10 million data points.
I made a tree map of the data (those pretty boxes above), and now I can see competitors. The bigger the box, the more they rank for words that also drive conversions. I can then use filters in Power BI by keyword. As I click on a competitor, I can see the number of unique URLs they’ve produced that rank in the top 20. I can use a rank slider to adjust from top 20 to a different number.
In my next post, I’ll do a video on how to talk about the data with further ideas on clustering and filtering.
Happy clustering! Go get that long tail.
Trending Articles