Problem 1: How do I efficiently monitor campaign performance, and identify what caused changes over time?
One of the most common ways to keep a pulse on campaign performance is through regular reports. Unfortunately, reporting is a challenge that every digital marketer faces. With the ability to track data at every step of a user’s interaction, marketers strive to create regular reports that show the value of paid search, and how their efforts are improving the impact that investment has on the business.
The goal here seems simple enough: create and deliver reports that show the value of paid search, and the optimizations that I’m making to improve performance. While simple in concept, this goal is far more difficult in execution. There are often a few questions that arise right away:
- How do I streamline reporting so that I’m not spending hours putting together reports every week?
- Once I create my reports, how do I actually know what caused these changes over time?
Solution 1: Automate your reporting and create a data flow chart
Automating paid search reports isn’t as scary as it sounds, especially with the help of Google Data Studio. This free tool from Google will help you to bring all of your data into one place, and allow you to refresh your reports in real time with its direct connectors to platforms like Google Ads and Bing. Setting up your regular reports in Data Studio can bring the time you spend on building weekly/monthly reports down from hours to minutes.
Leverage Data Studio to automatically build of trend lines like the ones found below:
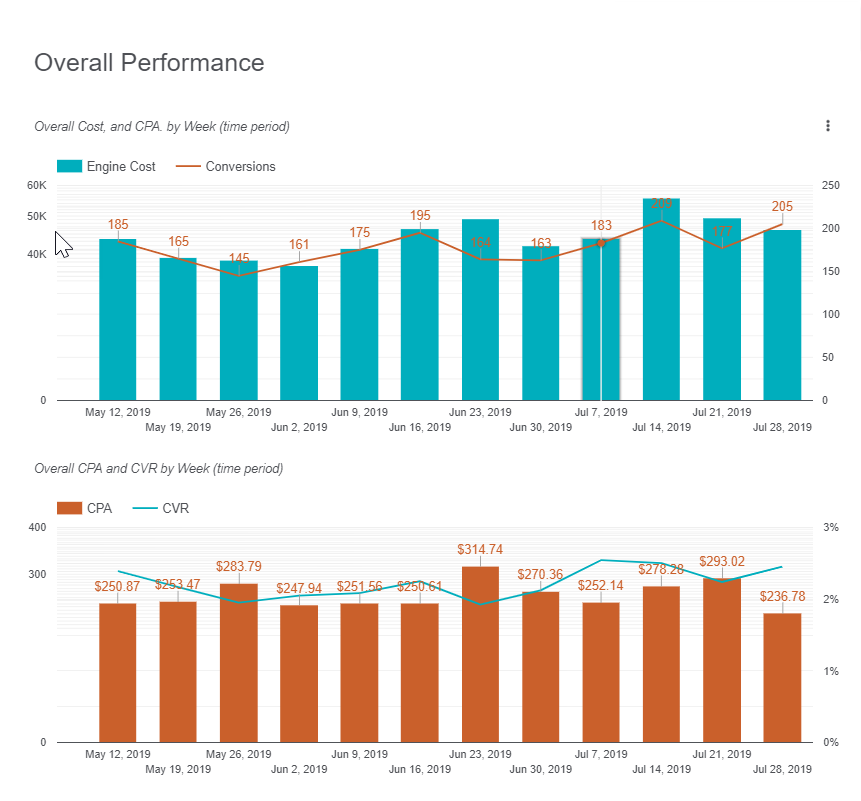
Once you’ve got your data sources connected to Data Studio, it’s up to you to create a compelling report that tells the story of your campaign performance. There are many unique visuals built into Data Studio that you have at your disposal. While common visuals like bar charts and scatter plots provide value when used correctly, the goal of these reports is to not only reduce your time building the report, but also reduce the time you spend analyzing the performance data displayed within the report. This means you should easily be able to identify what changed every week, and why.
A great tool to present these insights in an easily digestible format is a flow chart. Below you can see an example of one of these flow charts that shows a hierarchy of data flow, and what some of the root causes might be behind changes in performance.
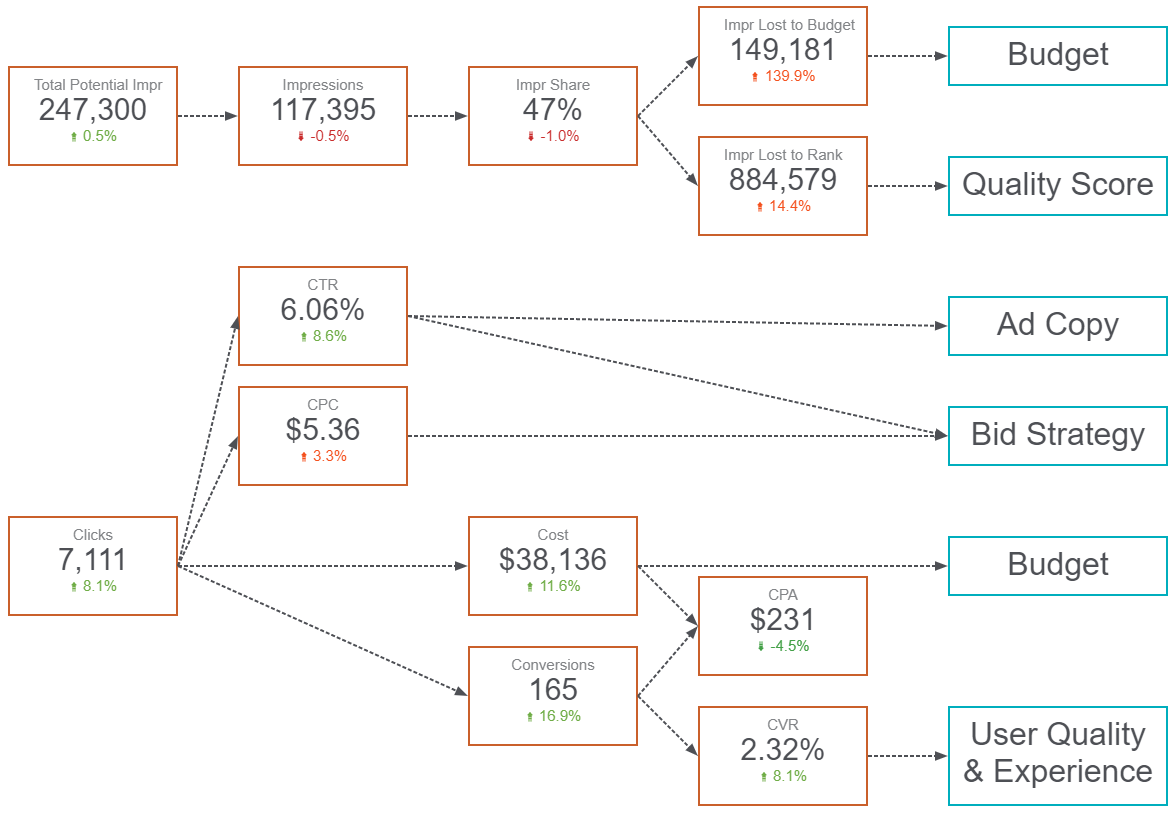
(H/T to Adalysis for the inspiration behind this flow chart!)
Example: Did you see a drop in conversion volume this week? Check out CVR; what does performance look like here? Maybe your ads were being triggered by irrelevant search terms, or there was a change made to some of the landing pages your ads are leading to.
Using a data flow chart can be a great way to diagnose performance fluctuations, and focus your tasks by identifying which component of your campaigns and strategy you’ll work on next.
Problem 2: I’ve found out what caused the changes in performance, but what do I do next?
When you eventually get your automated report and flow chart setup, you can easily determine that the drop in conversions this week was the result of your campaigns capturing lower quality users, or providing a worse user experience than the week before. While the flow chart took you this far, the next steps can still be a little ambiguous.
You know you want to improve the quality of users that you’re targeting in your paid search campaigns, but you’re not quite sure how to go about doing that. There are a myriad of analyses to run, and rabbit holes to go down, and this is where your knowledge of the account will be important.
Solution 2: Figure out what questions you want to answer, and perform an analysis with the goal of answering these questions
Continuing on with our example, the overarching goal coming out of your weekly report analysis could be to increase overall conversion volume by addressing the change in the pool of users that clicked on your ads. The change in the quality of these users is what caused CVR to decrease. Now all you have to do is determine what changed about these users. Easy right?
A good method of breaking this goal down is to determine what questions you want to ask about any potential root causes to a change in CVR. For example:
- Are my campaign ads being triggered by irrelevant search queries that don’t align with my business?
- Has there been a change to the landing pages of my campaigns recently?
Identifying the underlying questions you want to answer helps to streamline the analysis and optimization process.
Continuing with our example, let’s say you know that the landing pages in your campaigns haven’t changed recently, so it makes more sense to look at irrelevant search terms triggering your ads. Now you know that you’ll need to perform a search query analysis to find queries that are irrelevant to your business, and negatively affecting performance.
Pro Tip: Templatize analyses that you perform more often, so that you can further streamline your work-flow. Templatizing analyses can easily been done using tools like Power BI — check out our guide here!
After completing your search query analysis, you’ll have a list of irrelevant search terms you’ll want to negate, and even some potential keyword additions to improve the quality score, volume, and efficiency of your campaigns.
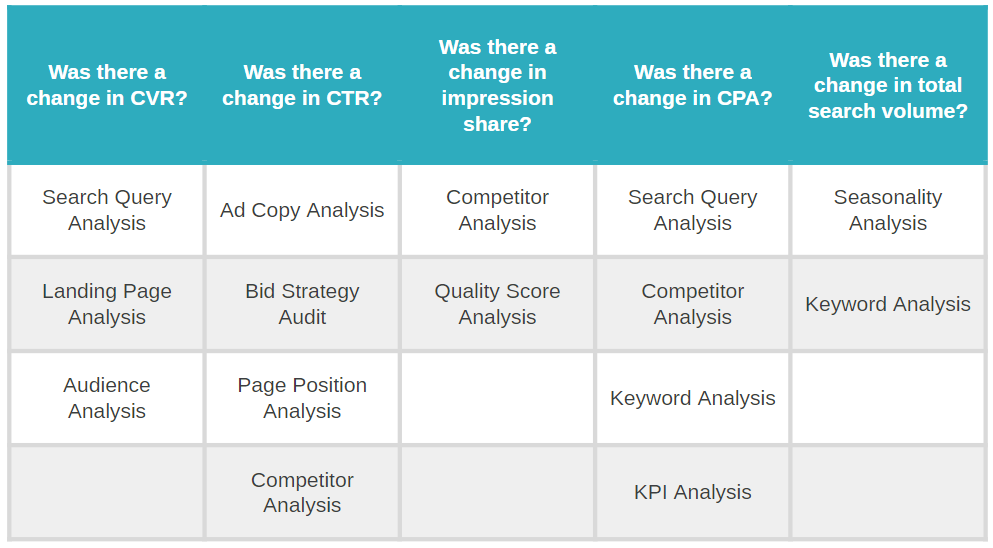
Bonus: While this particular example walked you through one potential optimization, there are limitless analyses that can help to answer a variety of different questions. The table below gives some examples that might be more common in everyday paid search management.
Problem 3: How do I tie it all together?
At this point you’ve spent quite a bit of time developing your streamlined process, but how do you know if it’s working? How do you know if any of this is actually helping to change performance?
Don’t worry, there aren’t any new reports or analyses to create at this point.
Solution 3: Implement your optimizations and use the reports you’ve already created!
The last step in the process is where you get to display your value as a digital marketer. By keeping track of what type of optimizations you make, and when, you can easily tie these optimizations to changes in performance.
Using your existing Google Data Studio report, you can use the same flow chart to look for changes in performance where you expect them to be. This means that if you implemented your findings from a search query analysis with the goal of improving CVR, that should be the first place you check the next time you run your report.
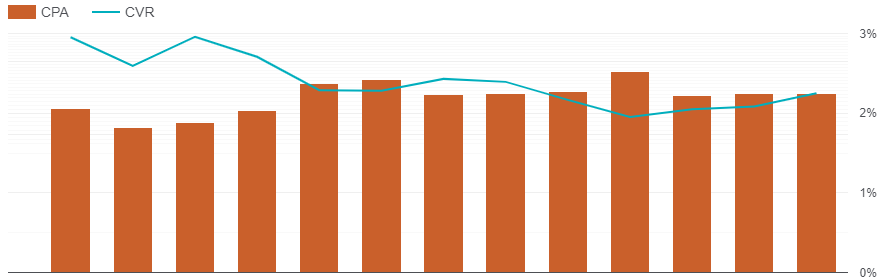
You can actually read the flow chart backwards in this instance. By narrowing down to the campaigns that were affected by your search query analysis, you can jump right to investigating changes in CVR. Did CVR improve? Great! Did this cause an increase in overall conversions volume? Ever better! It also always helps to include a time series graph somewhere in your report so that you can tie back your optimizations to changes in performance period over period.
Success Story: Using an automated Data Studio report helped one account team at Seer to quickly flag a drop in conversion rate, and dig into landing page performance. From there, landing page updates were made that drove an increase in conversion rate of up to 55% in the updated campaigns over the next three weeks.
While this process may seem like a lot after running through this blog post, it’s actually quite simple and will save you countless hours once you have your system down. Soon enough you’ll be improving the performance of all of your paid search campaigns faster than you ever have before.
If you’ve got any other questions about paid search, or PPC in general, feel free to reach out to the greater team here at Seer!
Trending Articles