While most digital analysts understand Google Analytics, many can find Adobe Analytics to be a complete mystery. If you are one of those people, you’ve come to the right place. Let’s dig into Adobe Analytics and get you up to speed!
First, let’s establish why Adobe Analytics is important to understand, and define some dimension and metric differences between Google Analytics and Adobe.
Benefits of Learning Adobe Analytics
- Similar to tools likeGoogle Analytics 360, Adobe Analytics offers notable benefits and features (avoiding sampling, custom tracking flexibility, etc.), justifying the notable yearly cost associated to it.
- Becoming familiar with Adobe will naturally expand your analytics skills! While many elements of Google Analytics tracking are applicable to Adobe; Adobe’s new features, tools, and caveats will deepen and enrich your analytics knowledge base.
- If you understand the features within Adobe, you willsave yourself time as well as others by quickly solving complex analysis problems, creating expansive and actionable reporting, and setting up strategic tracking.
Comparing Dimension and Metric Set-Ups in GA and Adobe
Now that we’ve established why Adobe Analytics is important, let’s look at some high-level dimension and metrics differences between Google Analytics and Adobe Analytics, and establish why the scope of dimensions and metrics is so critical to understanding any analytics set-up.
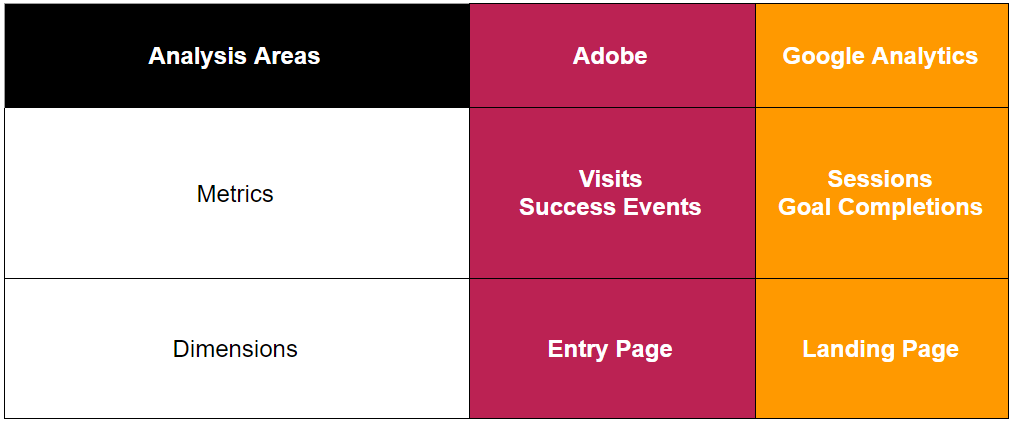
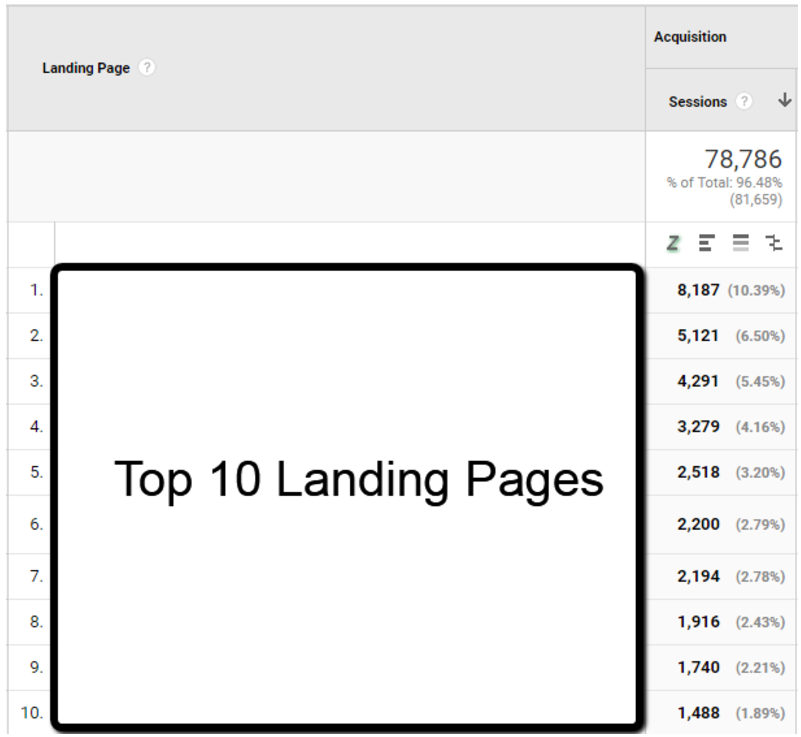
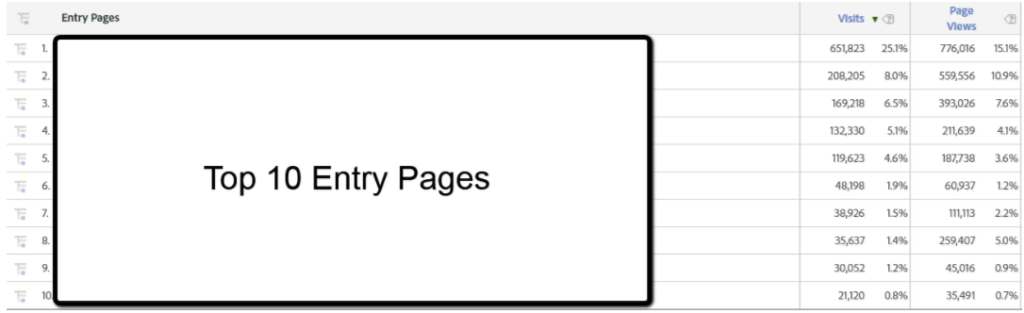
Adobe Entry Page vs. GA Landing Page
Looking at Adobe data, one of the first things you will likely notice is that sessions are now visits, and landing page is now entry page. As these are two extremely visible aspects of GA & Adobe, it’s important to note the high-level naming difference.
Google Analytics
Adobe Analytics
GA Goal Completions vs. Adobe Success Events
Another notable difference is GA goal completions vs. Adobe success events. For Google Analytics, each goal completion is counted once per session, where in Adobe, each success event counts each time the item occurs in a visit.
For example, if a conversion/success event in each platform is playing a video on the site, and you watch 5 videos in a single session/visit, in Google Analytics that will trigger only 1 video play goal completion, but in Adobe Analytics that will trigger 5 video play success events. When you think of Adobe success events, think of total events in Google Analytics.
Dimension and Metrics Scope
An important aspect of all analytics is the scope of dimensions and metrics. Scope affects data collection, aggregation, and even the way you analyze data.
Ensure that you are matching the correct dimensions and metrics by scope when doing analysis, otherwise you run the risk of misleading your report stakeholders which leads to poor decisions based on this data.
So what are these scopes, and how do they differ between Google Analytics & Adobe?
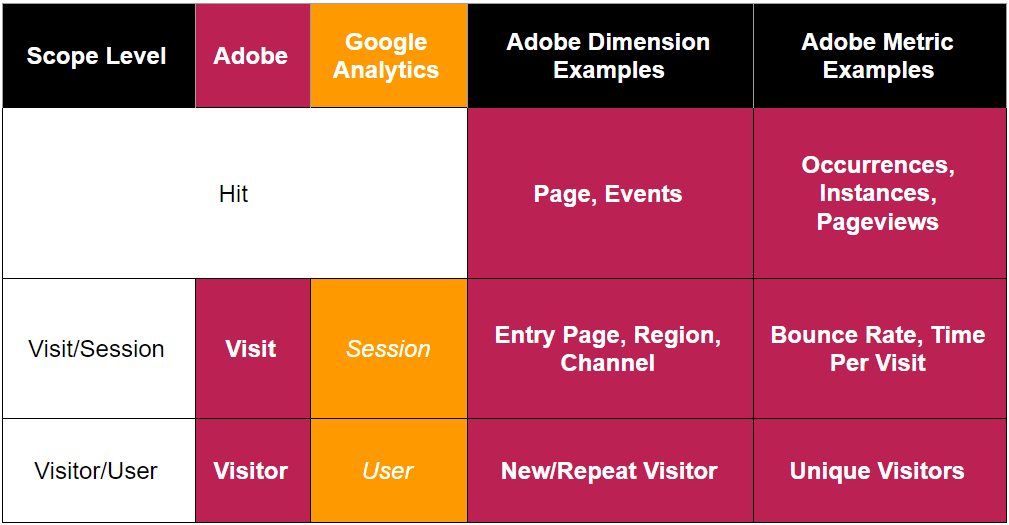
- Definition:The building block upon which all other data is formed. Measures each individual interaction on the site (think pageviews, events).
- Google Analytics vs. Adobe Analytics:Standard across Google Analytics and Adobe.
- Main Takeaway Tip:You want to match hit dimensions to hit metrics (i.e. page with pageviews).
- Definition:Multiple hits make up a session/visit. The most heavily featured scope across both platforms.
- Google Analytics vs. Adobe Analytics:Different in naming across Google Analytics (session) & Adobe (visit).
- Main Takeaway Tip:These session/visit-level items can occur once in this scope, such as entry page, region, etc. Should match session/visit dimensions with session/visit metrics (i.e. entry page with visits and bounce rate, etc.)
- Definition:While multiple hits make up a session/visit, multiple sessions/visits make up a visitor/user.
- Google Analytics vs. Adobe Analytics:Different in naming across Google Analytics (user) & Adobe (visitor).
- Main Takeaway Tip:This typically is the most hidden scope in both platforms, but can provide powerful analysis, allowing you to be more audience-focused. Should match visitor/user dimensions with visitor/user metrics (i.e. new/repeat visitor with unique visitors).
See a more visual example of this breakdown below:
Now that you understand the scope of dimensions and metrics and how they differ between Adobe and Google Analytics, you are ready to jump into the Adobe interface. Let’s do it!
Navigation of the Adobe Interface
Once you’ve logged into the Adobe interface, you’ll be presented with the layout of report options (may differ slightly by account), which we will break down piece-by-piece:
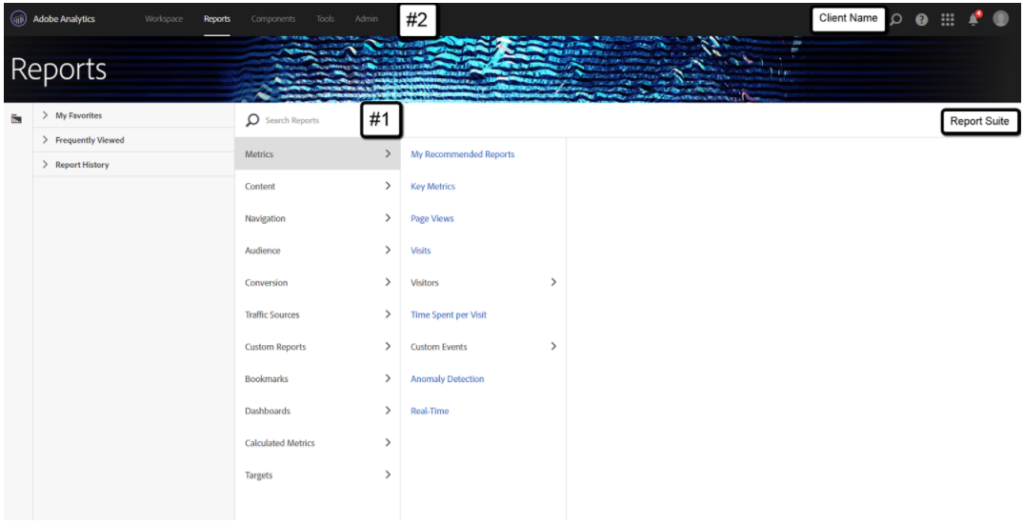
#1: Report Navigation
The search reports and navigation element allows you to find what report you want, either through typing in the report name or navigating through the sections. Let’s see how we can find the entry page report with both options:
#1A: Search Option
By typing in the report name itself, you’ll see which reports have this naming, and then can select the report that is more relevant to you. See below for the entry page report:

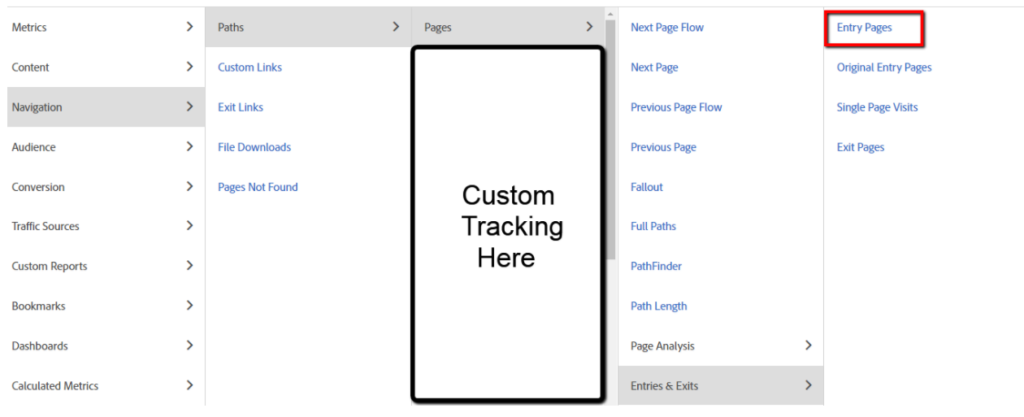
#1B: Navigation Option
In this case, we don’t type the report name in, but rather click through the report structure to find it. You’ll notice that under the search option, this shows the same route that we use in the navigation structure to reach the report.
#2: Top-Nav Bar
The top-nav allows you to easily navigate between Adobe’s interface. When you first log in to Adobe Analytics, this default to opening on the reporting tab. You could update in the future to land on the Workspace option as well. You could also not see the Workspace option if you don’t have access to this area (granted under your user-level rights).
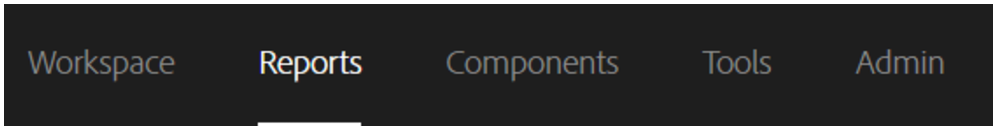
Let’s break down each of the options available in this area.
- Workspace: This links toAdobe’s Analysis Workspace tool, which I’ll expand on in a future post. Some pretty amazing report, analysis, and visualization capabilities with this tool. Check on Benjamin Gaines session from the Adobe Analytics 2017 Summit for some cool insights here!
- Reports: Your current view, allowing you to pick among report options.
- Components: Allows you to manage segments, create calculated metrics, manage scheduled reports, etc.
- Tools: Allows you to access non-Workspace Adobe tools, such asReport Builder & Ad-Hoc Analysis. Report Builder is an add-on to Microsoft Excel, and is very useful for report automation. It functions in a similar manner as the Google Sheets Add-On does with the Google Analytics API. I’ll expand on Report Builder usage in a future post as well.
- Admin: Depending on your user access (either admin or user), this allows you to create new users, update Adobe report suite configuration settings, etc.

- Report Suite: On the far right of the screen (on the same level as the report search), you can change the Adobe report suite you are viewing (think Google Analytics account or property). For more advanced users, Adobe offers other types of report suites:Virtual and Global/Roll-Up being some of the major options.
Standard Adobe Report
Now that we know the basic interface, let’s explore a simple report (entry pages):
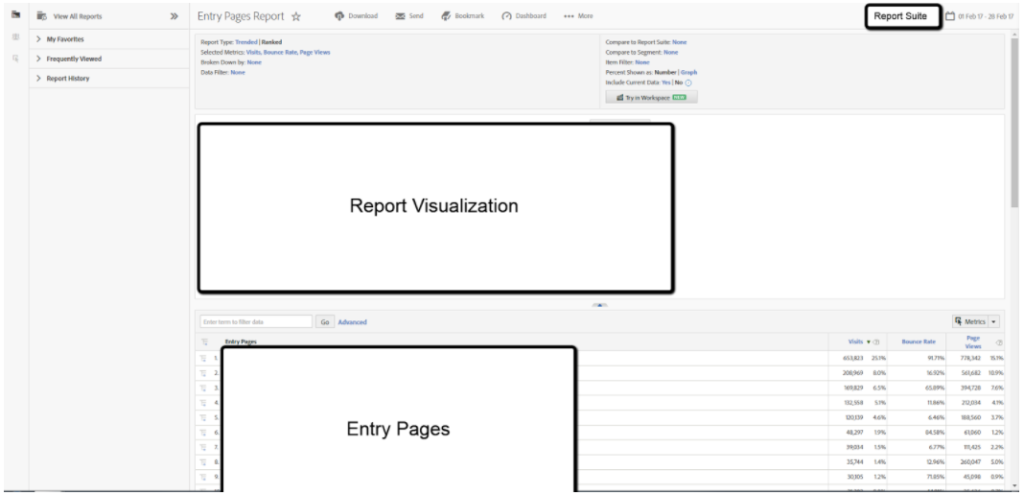
On the upper left-hand side, with the three icons, you have the options to (from top-to-bottom):

- View Reports: Navigate away from the current report
- Apply Segments: You can apply multiple segments at once (will find the overlap of all segments), and create and manage segments (which align to the dimension and metric scopes you choose!)
- Change Metrics: You can pick which metrics you have in the report (which should align to the dimension and metric scopes of the report). Let’s move our attention to the top-nav of the report itself (from left to right).

- Each of the symbols mean the following:
- “Entry Pages Report” – Name of the report
- The Star– Favorite the report to come back to for future reference (under your login)
- Cloud with Arrow– Download the report (Excel, PDF, etc.)
- Envelope– Send the report via email
- Book – Bookmark the report
- Speedometer– Add to an Adobe dashboard (less useful than Adobe’s other reporting options [Analysis Workspace being the main] in my opinion)
- Three Dots– contains more options, one of which is a quick link option (great for sharing reports with others – allow for them to come directly to the report upon login)
- The Cylinder– Which Report Suite the data is pulling from
- The Calendar– Allows for changing date ranges, and comparing dates (Adobe also allows you preset ranges – last month, last week, etc.). You can also create custom date ranges to fit your reporting needs
One last tip for the report layout: You can use these reports to drill down further based on what you have selected. This is located as shown below:
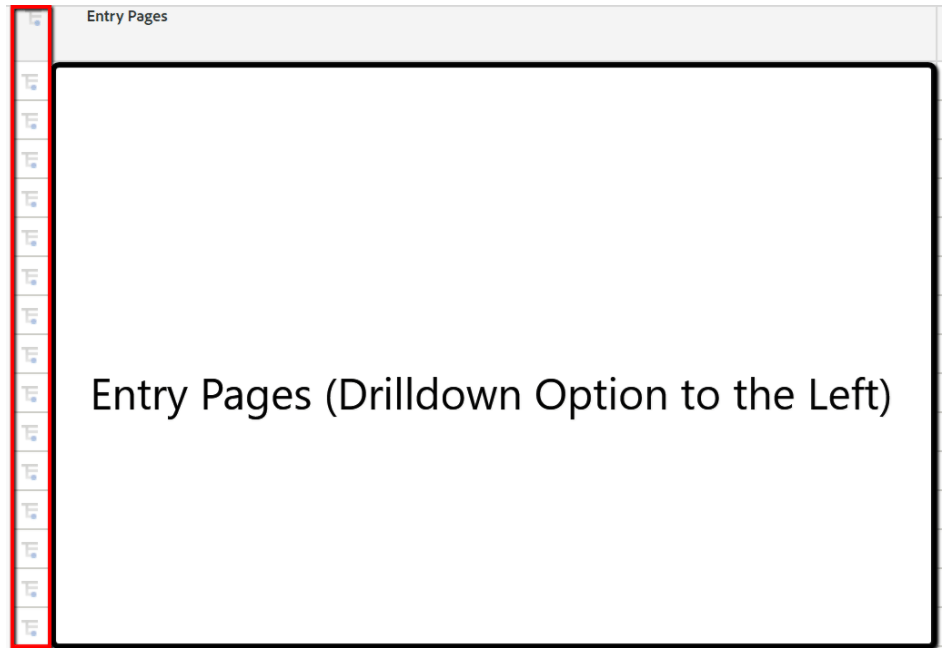
Want to see what channels drove visits to these entry pages? How about a breakdown by mobile device type? What can the regional data tell you about your paid targeting efforts? The possibilities are nearly endless. Go explore!
With these tools, you now how have the ability to:
- Understand how Adobe Analytics functions, why it is important, and how it differs from Google Analytics.
- Navigate the Adobe Analytics interface and basic reports.
Upcoming Adobe Tips
that you have this knowledge, if you have the opportunity, get in there and explore! What questions do you have based on what you’ve found? What are the hidden gems of Adobe Analytics that you use? Let me know in the comments!
However, truthfully, this is just the tip of the iceberg in relation to Adobe Analytics knowledge. To truly understand what Adobe offers, you’ll want to understand the following topics as well:
- eVars (custom conversion) vs. sProps (custom traffic): How custom tracking with Adobe fundamentally works.
- Adobe’s Pathing & Fallout Tools: How Adobe’s PathFinder and Full Paths reports differ from Google Analytics’ pathing efforts, and how you can integrate pathing and fallout reporting into Analysis Workspace.
- Adobe Analysis Workspace: How Adobe’s main reporting and analysis tool is competing againstGoogle Data Studio, and how it provides one of the most flexible and powerful interfaces of all major data analysis tools.
- Adobe Report Builder: How Adobe’s reporting automation tool stacks up against Google’s options, and how to most easily integrate it into your Excel reporting set-up.
Stay tuned for more information on these areas in future posts. Happy data digging!
Trending Articles