5 Sales Indicators All E-Commerce Retailers Should Monitor
By: SmallBizClub

Consumers’ habit of getting into their cars and driving to malls or department stores to get their shopping done is slowly but surely dying out. These days, people prefer to have items delivered right to their door. And as soon as they order at that.
More and more businesses are adopting ecommerce-centric business models, and rightfully so. As first-mover advantages in keep diminishing across markets, failure to create a seamless digital platform will have visitors leaving for competitors without a second thought.
But with changes in buying habits and unceasing evolution of digital marketplaces, the new reality is that ecommerce is constant game of analysis and optimization. With this in mind, here are five crucial key performance indicators (KPIs) you need to keep a close eye on.
New vs. Returning Customer Ratio
Monitoring conversion rate on your website or app goes without saying. But, a crucial KPI to watch (within conversions) is the composition of unique and recurring customers. Basically, the question “How many visitors are buying from you for the first time versus those who’re buying again?” gauges your rate of customer retention in relation to your online presence over a specified period of time.
It’s important to realize the way in which a new customer interacts with your ecommerce site is much different than the way a returning one does. And returning customers tend to spend far more than new ones, not just due to the fact that they “know you well;” a Monetate study of the 2015 holiday season reported that returning shoppers spent nearly twice as much money as new shoppers $5.3 billion vs. $2.7 billion.
While building and maintaining a loyal base of returning customers is definitely essential for ecommerce success, there also needs to be a constant focus on bringing in new customers in order to grow the business.
Traffic Sources
In addition to monitoring new vs. returning customers, you need to keep a close eye on where these visitors are coming from. Luckily, Google Analytics neatly divides up all your website’s traffic information and groups it into categories based on demographics, geography, interests, and of course, traffic sources.
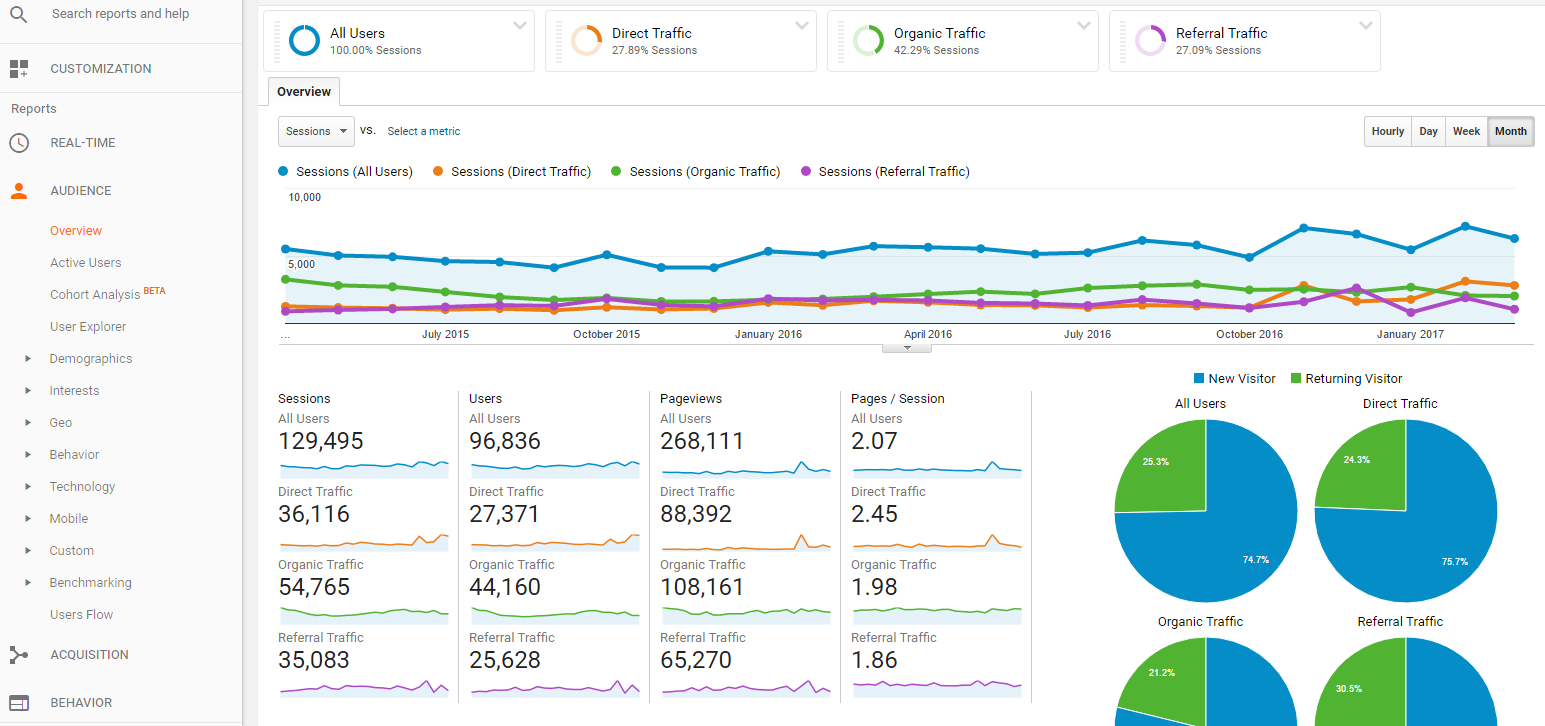
The most common channels that bring traffic to a site are:
- Direct – Visitors who landed on your website by entering the exact URL into their browsers
- Organic – Visitors who found your website by querying a search engine
- Referrals – Visitors who followed links from other websites to yours
- Email – Subscribers who clicked through links in your emails
- Social – Visitors who came to your site through links shared on social media networks
- Paid – Visitors coming from pay per click or other digital advertising campaigns
Monitoring this information gives you an idea of which marketing vehicles are working well in driving web traffic, as well as areas you need to improve upon.
Bounce Rate
Bounce rate refers to the ratio of people who land on your website but leave without clicking through to other pages to those who do. It is simple to calculate: if you have a total of 100 visits on your site and 56 people left without taking action, your bounce rate is 56%.
Regardless of how great your online store is, there will almost always be a bounce rate. Don’t take it personally.
This is an interesting KPI for ecommerce businesses. Even though it is hard to determine what a “good” bounce rate is, this metric can tell you a lot of about your marketing techniques.
For example, if you have a high bounce rate on your homepage, and the bulk of your traffic comes from organic search, a common inference might be that you are ranking for the wrong keywords in your SEO strategy, because your visitors’ intent is completely different than what you have on offer. When this is the case, it’s either time to return to the drawing board and conduct additional keyword research or optimize your web copy and landing pages to clearly communicate the benefits of your products or services to your visitors.
This KPI essentially tells you where the bottlenecks are within your interface. If your product pages have high bounce rates, it might be time for a revamp. While there is no need to obsess over this stat and no ideal bounce rate in general (you might find industry benchmarks), you should always be working to lower it in some way or another.
Average Order Value (AOV)
The average dollar amount spent each time an order is placed is an extremely important KPI to keep an eye on. Having a firm grasp of this metric helps you gauge the effectiveness of your overall marketing, the perceived value of your brand, and make appropriate changes to your pricing strategy. You’ll also have the additional benefits of being able to measure the value of each customer and make educated guesses about their purchasing habits.
Calculating AOV is pretty straightforward. You simply take the total revenue and divide it by the total number of orders placed. If you have $10,000 in revenue from 105 orders, your AOV would be $95.24.
There are a number of ways to improve AOV throughout your entire sales funnel. Several strategies include:
- Offer free shipping on a minimum purchase
- Upsell relevant products
- Retain customers by offering deals on their next purchase
- Support causes that matter to your audience
At the core of your ecommerce strategy, improving AOV is what drives direct revenue and boosts profits across the board.
Cart Abandonment Rate
This is another easy metric to calculate; you take the total number of times customers added something to their cart, but didn’t go on to buy it, and divide this by the total number of carts started. If you had 50 people add stuff to their basket but 38 of them didn’t place an order, your cart abandonment rate is 76%.
Cart abandonment is a reality all ecommerce brands are faced with. Unfortunately, this KPI is rather high and can be incredibly difficult to improve. In fact, last year, the average cart abandonment rate was 69.23%. This can happen for a variety of reasons.
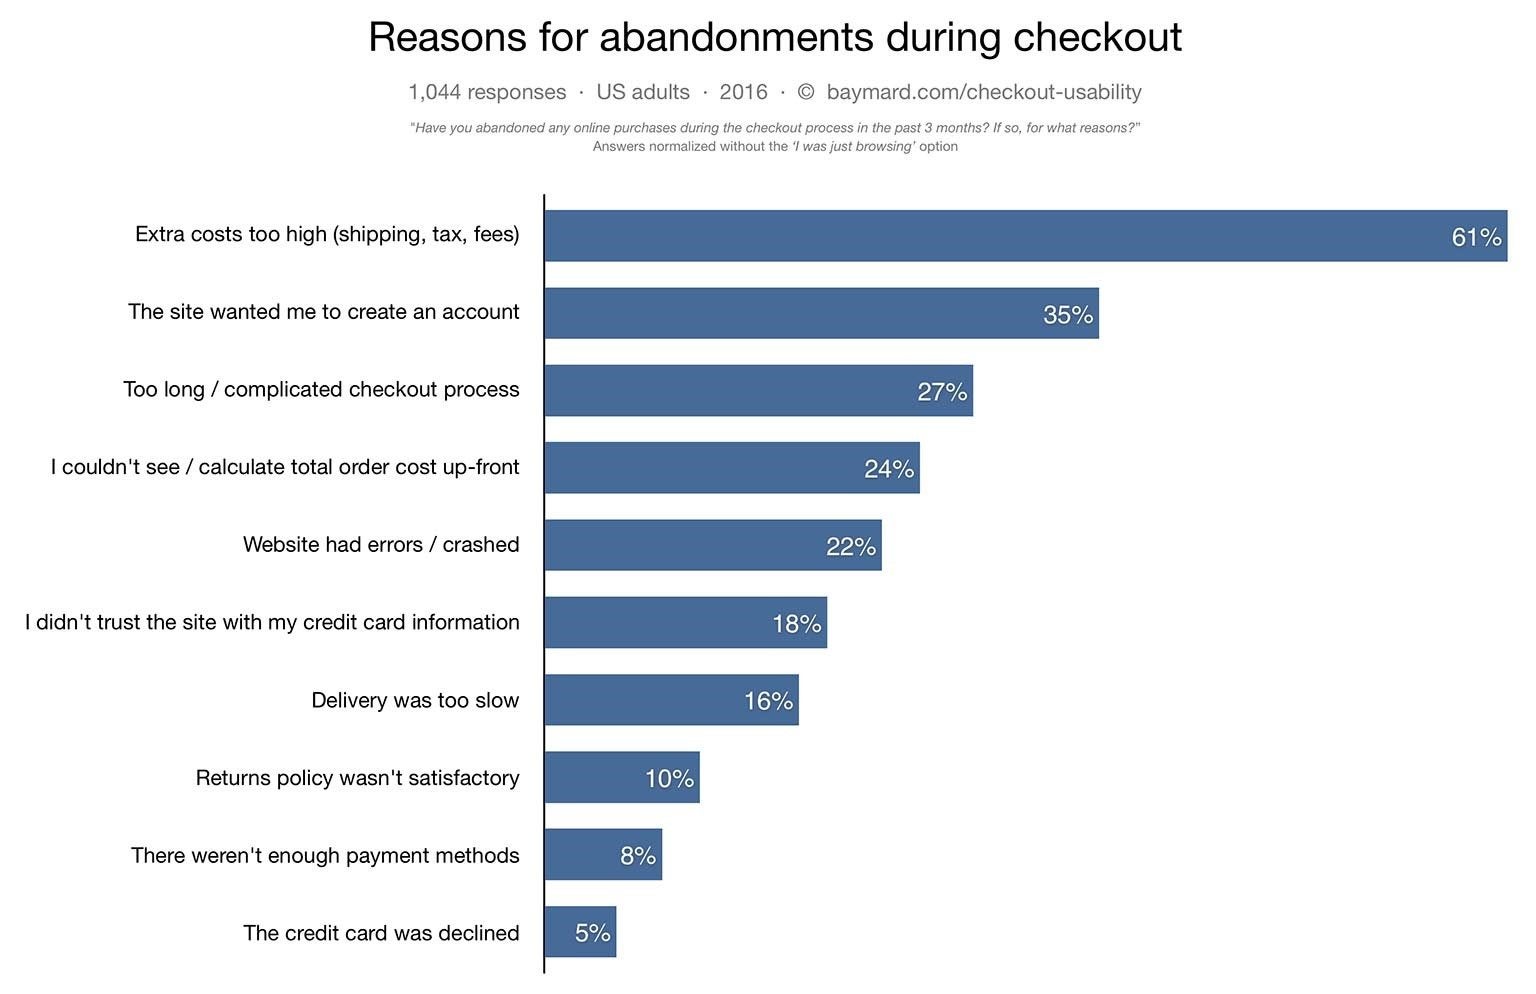
While there is no set formula for improving this metric, your goal should be to eliminate as many hoops as possible that the customer has to jump through in order to buy from you. Each step through the checkout means they have another chance to rethink their decision. Simplicity is very important here; one of the common features among successful ecommerce sites is a simplistic checkout process.
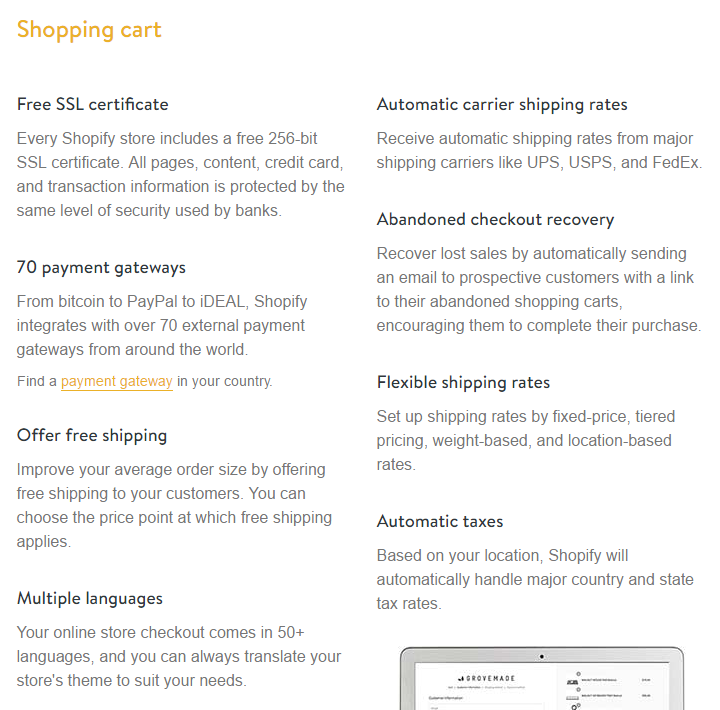
Every single element on an ecommerce website ultimately leads to the checkout. If this part is poorly crafted, your conversion rate will suffer. Your choice of ecommerce platform can make all the difference here – a customizable one like Shopify will ensure your shopping cart has the requisite functionality and features that appease the expectations of the most diverse range of visitors.
Keep your eyes on your visitor funnel all the time to see how your checkout pages are faring.
Wrapping Up
Operating an ecommerce business is a never-ending series of trial and error. Your website is only as good as its last sale. Marketing strategies that resulted in a spike of traffic one day might be completely useless the next. Be sure you are constantly on top of these five KPIs and using them to improve your strategy.
 Author: Lori Wagoner is a marketing researcher, content creator and strategist who works with small businesses and organizations to help them gain online visibility. Feel free to strike up a conversation on Twitter @loridwagoner.
2905 Views
Trending Articles