 Alex Padurariu/Unsplash
Infographics continue to become more and more popular. Entrepreneurs are jumping on the infographic bandwagon to increase traffic, exposure, and conversions for their brands. Infographics can help tell your story by visually representing information that’s relevant to you, your industry, or potential customers. It can explain complex ideas and processes, educate your readers about the benefits of something (and why they should care), and inspire action.
To help you increase your sales, here are nine tips for making effective business infographics.
-
Create Stand-Alone Infographics
Don’t make infographics that require context to understand. If people can’t understand it without clicking through to another site (or having the code in front of them), you’ve failed. You’ll lose readers if they must click away in order to be able to fully appreciate your infographic, so keep the reader experience in mind when creating your infographics.
-
Keep Your Design Simple
If you don’t design infographics yourself, hire a designer who will create original work that has vision and is aesthetically pleasing. There are lots of different styles out there with examples that range from arrows pointing at market share numbers on individual pie charts, with thin light font telling me exactly what I need to know on top of an ancient castle, to a simple and clean design with big and bold numbers in the market-share pie charts.
-
Make It Interactive
Interactive infographics can be more engaging than ones that aren’t. A good infographic example like the History Flow infographic tells you all about history using interactive timelines. You can use your mouse to scroll through time and view events from different perspectives such as technology or religious influences over time. The interactive infographic allows readers to choose what they want to see instead of just viewing information in a linear fashion.
-
Tell A Story with Your Infographic
The best infographics can communicate complex data points quickly and easily by using images that explain (rather than text). There’s no need for lengthy explanations when you have an infographic, so it makes sense to use images to your advantage. With the help of strategically placed arrows and other visual cues, you can show rather than tell what’s happening in the data.
-
Make It Useful or Fun
People are more likely to share something useful or fun, rather than simply informative. Use cool infographics to motivate people by giving them something they can apply to their lives or careers immediately. They’ll appreciate the usefulness of the information while having fun along the way! Think about using infographics as a teaching tool instead of “just another image.” Charts and diagrams are great ways to get across complex ideas quickly without taking up too much space on your website. Also, to make infographics even more helpful, you can infographics as brochures for your marketing strategy.
-
Incorporate Your Company’s Visual Identity
Simple infographics should reflect your company’s visual identity, including fonts and colors. This will ensure that the infographics created for your brand are uniform with other marketing materials like eBooks or blog posts. A single style guide can make it easier to brand all the different types of graphics you produce (like infographics). Stock photos and images generally aren’t a great idea since they’re often copyrighted material, but there are lots of free images on the internet that you can easily find through Google or by checking out Creative Commons sites like Flickr.
-
Research Keywords and Include Them in Your Infographic
Use descriptive keywords that people might search for to discover your infographic via search engines. You want to make it easy for people to find your infographic when they’re doing research, so be sure to include your target keywords in the title and description of your infographic.
The trick is that you simply need to discover what makes an infographic successful in terms of search engine optimization (SEO). Google Trends can help determine when enough people are searching online with a particular keyword for its associated images to show up in Google Images search. If you want more information on how infographics fit into SEO, head over here.
And remember: Don’t forget about mobile! The look and feel of an infographic should be optimized for mobile devices like smartphones and tablets since most users access the web from their mobile devices these days. Make sure all your images and texts are readable when you resize your browser window to the width of a mobile device.
-
Use Data Visualization Tools to Create A Professional-Looking Infographic
You can easily create infographics with free tools that help turn data into graphics! There are lots of infographic design programs out there, but for this example, we’re going to use Venngage. They have more than 100 infographic templates for you to choose from, so I just picked a topic and went with it.
Once you pick a template, all you need to do is add your own unique content and update any existing images with ones from your computer or Google image search. Then, spend some time thinking about how you want to arrange everything before publishing your infographic. To give you an idea, here are some Venngage infographics to check out.
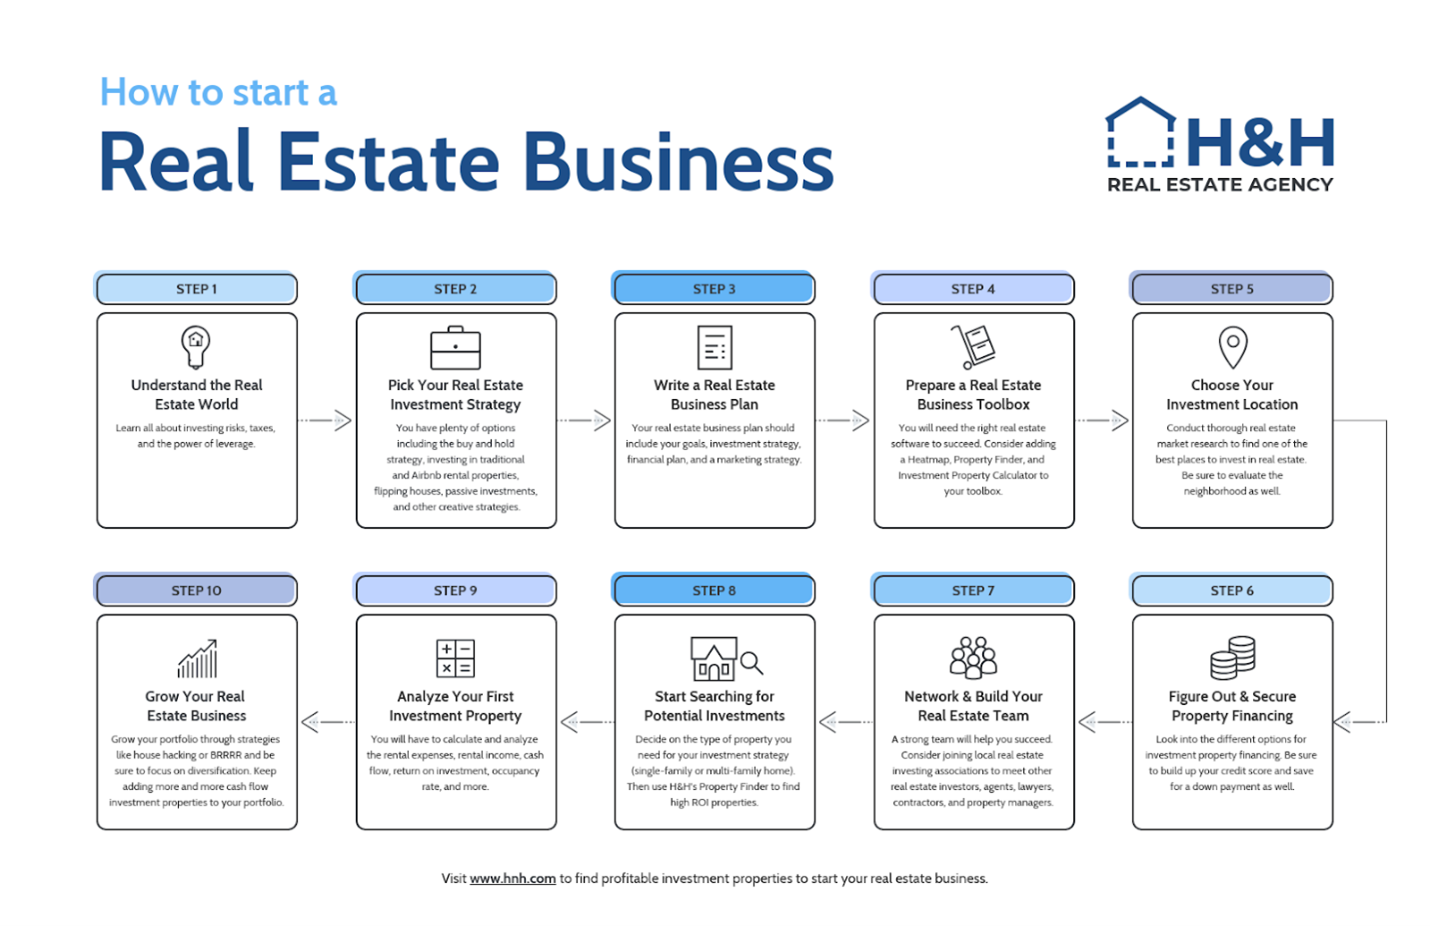 Venngage
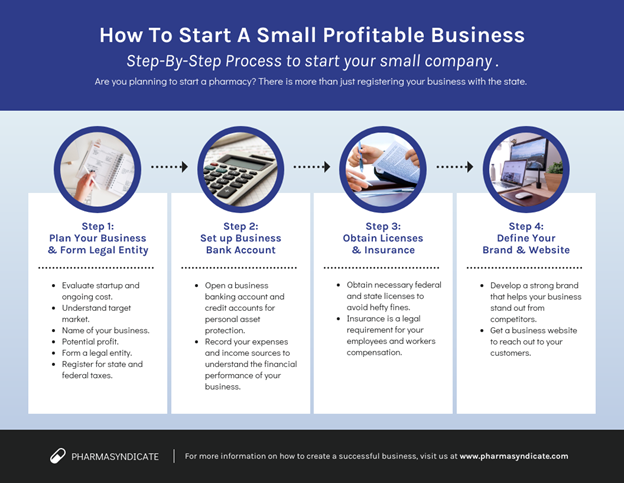 Venngage
 Venngage
-
Get Your Infographic Shared Across Social Media
Social media is a great way to get more eyes on your infographic, but you won’t receive much exposure unless you have people sharing your creation. Twitter, Tumblr, and Reddit are just a few places where infographics can rack up thousands of views in just one day. Just be sure to ask for permission before posting someone else’s work! It doesn’t matter if you’re looking for backlinks or just trying to drive traffic – the important thing is that you put out awesome content that gets people talking.
Infographics can help two different brands communicate effectively with each other and their audiences, so long as they show what they represent clearly and concisely. There are lots of ways an infographic can benefit your business, and it’s up to you to determine what they are.
Infographics can also help get your business shared more on social media. Use infographic makers like Venngage to create professional-looking infographics that will get people talking about the topics you want to talk about.
2758 Views
Trending Articles