")
Essential Formulas for Your Google Analytics Data
By: SEER Interactive

Let’s be honest – we all know that there are TONS of spreadsheet formulas out there that make analyzing data so much easier, but how many of them do we actually use? While some of them are pretty easy to understand, others have a more complicated syntax that require several “inputs” to get your desired “output” value.
I first started researching more about formulas when I began to use the Google Analytics API for Sheets. It’s the easiest way to pull data directly from Google Analytics (GA), and formulas can be used to automate data so that I don’t have to repeat the same tedious tasks over and over.
I’ve come up with a short list of essential formulas that even further automate Google Analytics data in Sheets:
- End Of Month Formula
- If Formula
- If Error Formula
- Sum If Formula
- Indirect Formula
- Query Formula
Check out my examples below on why you should be applying these formulas to your Google Analytics data through Google Sheets!
1 – The End Of Month Formula
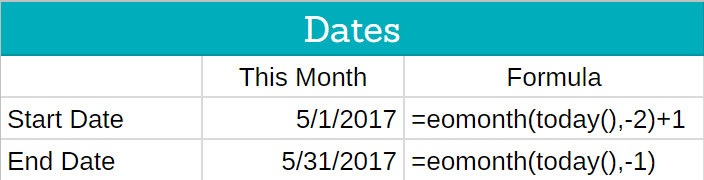
The End of Month Formula is used to automatically grab a date based on the log inside of the parenthesis. This formula makes it especially easy to get a date based on today’s date.
The Formula: =eomonth()
Below is an example for pulling monthly data for the most recent past month, using logic based on today’s date. The start date goes back to the last day 2 months prior(-2), and then adds 1 (+1) to get the first day of 1 month prior. The end date simply grabs the last day of the month 1 month prior (-1):
Once you have these dates set up in your sheet, you can reference them directly from the Report Configuration tab, and every month it will automatically update the dates! This can also be done for a daily report, weekly report, or any other time frame.
2 – The If Formula
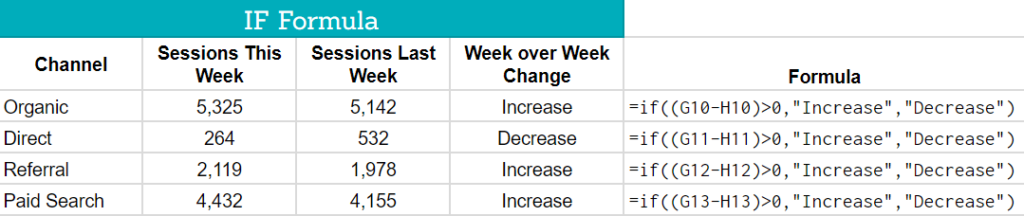
The If formula is used to return a value based on a logical expression being either true or false.
The Formula: =if()
For example, you can set a cell to equal either “Positive” or “Negative” based on a number being greater than zero or less than zero:
3 – The If Error Formula
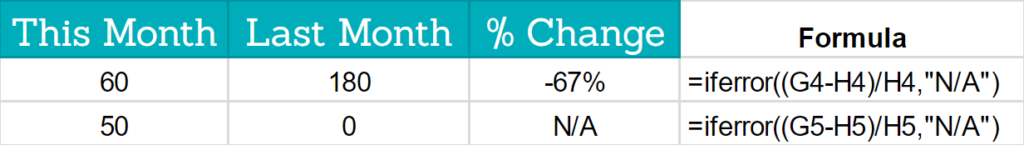
The If Error formula lets you assign a value to a cell in case it returns one of these annoying errors:

The Formula: =iferror()
When I create automated tables of data, I use the If Error formula so that any errors are replaced with a blank cell or a value of “N/A”. This is especially helpful when calculating percent changes that may contain a value of 0 in the denominator.
4 – The Sumif Formula
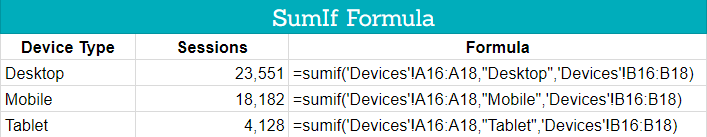
The Sumif formula is perfect for grabbing total metrics for different channels, devices types, etc. It allows you to add up data from a specified range based on whether or not a certain criteria is met.
Formula: =sumif()
An example of this formula in action is shown below to automatically get the sum of sessions for different device types, using the string values as the expression to match:
5 – The Indirect Formula
The Indirect Formula returns a value of a cell based on a string value that you specify.
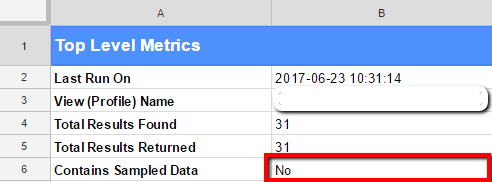
If you’re anything like me, when you build out your Report Configuration you’ll end up with at least 5 separate tabs of data pulls. One thing we might not always think of is that our API data can be sampled at any time, and the only way to see this is to look at each individual tab’s data:

Rather than going through each individual tab every time I run my reports, I set up an automated Sampling area that uses the =indirect formula to match the cell on each tab that contains the ultimate “Yes” or “No” for sampling.
The Formula: =indirect()
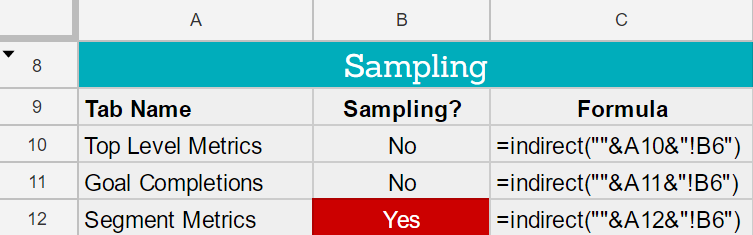
Conveniently, the sampling level is always located in cell B6 on each report tab. This makes automation a breeze, matching the cell B6 for each tab name in your report configuration.
In your Sampling table, reference each tab name in one column, and in another column use the Indirect formula to match cell B6 for each Tab name. You can even add in some conditional formatting to make any “Yes” matches stand out, so you’ll always catch any instances of sampling!
6 – The Query Formula
The Query Formula in Google Sheets uses Query Language to return cell values from a specified range. Various queries are used to order cells, group cells, or return cells based on a defined condition within the formula.
The Formula: =query()
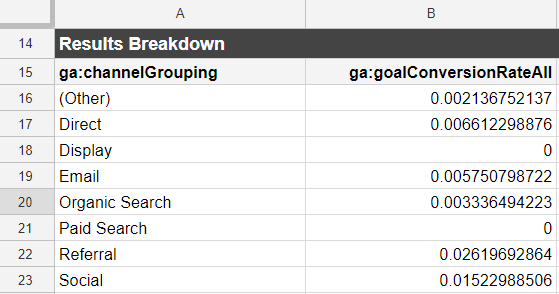
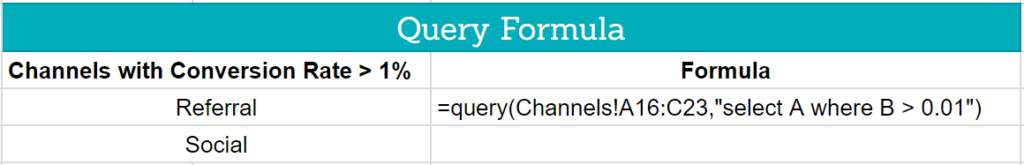
The Query formula is perfect for pulling data based on a more complex condition, such as selecting channels that have a goal conversion rate > 1%. The example below shows a query formula referencing a “Channels” tab with the following data:
Using the query formula, we can create a table of channels with a conversion rate greater than 1%, and this will automatically update each time you run your API with different date ranges!
As for the rest of the formulas…
You can check out this full list of Google Sheets formulas to search for other formulas and learn how to properly set them up!
What other formulas do you commonly use to automate your spreadsheet data? Leave them in the comments below!
Trending Articles