")

I like how easy it is to get to Twitter analytics and get some quick overviews of what has worked and what has bombed. Discovering your top tweets, top mentions, top followers, top media tweets, and the like is all summed up for you.
However, I’ve always wanted to know the most productive time of day to tweet and that’s not so easy to get to. If you want to find out when the most people see your tweets, or click on them, you need to download your analytic data and plug it into a spreadsheet.
It’s easy to do, but there are a couple of hoops you need to jump through, so let’s look at the process.
- Navigate to your Twitter Analytics page. If you’re already on Twitter, start typing “analytics” in the address bar and your browser will probably fill in the rest for you. If not, here’s the formula for the URL: https://analytics.twitter.com/user/your_twitter-handle/home
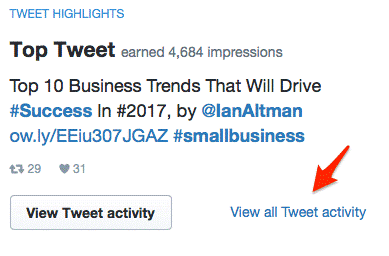
- Select “View all Tweet activity.”
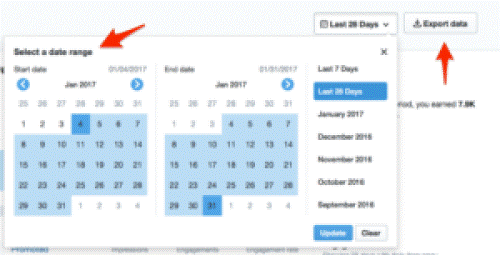
- The date range defaults to “Last 28 Days.” Click on that and you can select a custom date range. Then press “Export Data.” This creates a CVS file that you can open in Excel.
- Open the file in Excel and scan the “impressions” column for any outliers. Sometimes a tweet or two will do far better than all the others and these need to be noted and then deleted from the data. You’re going to do a graph to visualize the information and if these were allowed to stay in, the scale of the graph would be odd, making it difficult to see what’s happening with all the rest of your tweets.
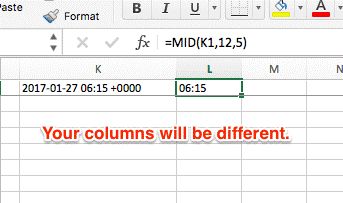
- You need to isolate the time of day using the “Mid” text formula as shown below. Create a new column for this that references the Time column you downloaded. This will become your new “time” column.
- Copy the new “time” and “impressions” columns to a new sheet. Delete the labels at the top of the columns when you do this, just for convenience.
- Replace all the colons with decimals (Replace All). Select that column and change the date type from “General” to “Numbers.”
- Sort these two columns by the “time” column.
- From the Excel “Insert” toolbar, select Scatter Graph. You’ll get something like the graph below. Right click the graph and set the axes so the time values are the X axis and the impressions are the Y Axis. If you have more than 255 values, you may have to divide your data and do more than one graph. I’ve put in the arrow to note the general trend.
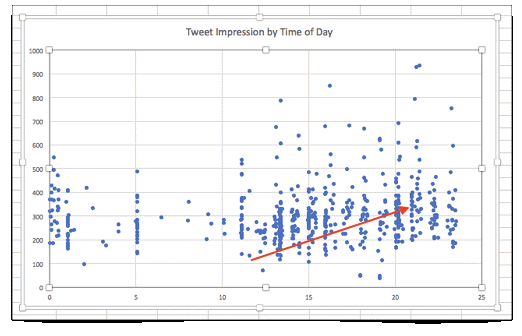
- It’s important to find the “offset” between your time zone and the one used in the time you have downloaded from Twitter. You can do this by grabbing one of the permalinks from the data you downloaded, paste it into a browser and then see when you posted the tweet in your time zone. I have a six-hour offset so it seems that more people are viewing my tweets around 3 p.m. Central Time.
When I looked at my data, I was a little surprised that mid-afternoon turned out to be the time when more of my followers see my tweets. I might be a little cynical here, but it could be that people work hard in the morning and then start goofing off a little and check their social media accounts in the afternoon.
Knowing your best hours for posting, you might reserve original posts for those peak times and do more retweets during the hours when fewer people actually see your tweets.
By the way, in my instructions I said that you need to “note” the outliers and delete them. After you’ve analyzed your graph, trace those outliers back to find out why they outperformed your more average tweets. That could reveal information that will help you increase the reach of your tweets in the future.
Trending Articles